
Last update December 17, 2002 at 04:10 UTC. Minor update posted at 10:56 UTC.
[Solar and geomagnetic data
- last 4 weeks (updated daily)]
[Solar wind and electron
fluence charts (updated daily)]
[Solar cycles 21-23 (last
update December 2, 2002)]
[Solar cycles 1-20]
[Graphical comparison of
cycles 21, 22 and 23 (last update December 2, 2002)]
[Graphical comparison of
cycles 10, 13, 17, 20 and 23 (last update December 2, 2002)]
[Historical solar and geomagnetic
data charts 1954-2002 (last update October 13, 2002)]
[Archived reports (last update December 16, 2002)]
The geomagnetic field was quiet to unsettled on December 16. Solar wind speed ranged between 428 and 540 km/sec under the influence of a weak coronal stream.
Solar flare activity was moderate. Solar flux was 202.9, the planetary A
index was 8 (STAR Ap - based on the mean of three hour ap indices: 8.9).
Three hour interval K indices: 22223322 (planetary), 12112222 (Boulder).
The background x-ray flux is at the class C1 level.
At midnight there were 9 spotted regions on the visible disk. A total of 12 C and 3 M class flares were recorded during the day. This includes the following optically uncorrelated events: C4.3 (its source appears to have been behind the northwest limb) at 02:26, a C2.9 long duration event peaking near 16:15, a C2.9 (most likely source: a spotless area west of region 10224) flare at 19:10, a C2.7 (most likely source: a bright plage area near the southeast limb) flare at 20:38 and a C7.9 flare (several possible sources including the area at the southeast limb, however, region 10226 appears to have been the most likely candidate judging from SOHO/LASCO images) at 21:09 UTC.
Region 10218 decayed slowly and quietly.
Region 10220 decayed quickly early in the day, then stopped decaying and was unchanged after late morning.
Region 10223 was mostly unchanged and quiet.
Region 10224 changed its appearance with several spots disappearing and others emerging. A positive polarity field
emerged just ahead of the leading penumbra and the region could be increasing its flare potential. An M class flare is possible.
Region 10225 developed slowly. There appears to be a weak magnetic delta in the northeastern part of the leading penumbra.
Further minor M class flares are possible. Flare: M2.5/1N (with associated weak type II and IV
radio sweeps and a weak CME mainly off of the northeast limb) at 11:15 UTC.
Region 10226 developed impressively with the penumbral area doubling over the last 24h. The region has two magnetic delta
structures, one just east of the leading penumbra, another in a central penumbra. Major flares are possible. Flares:
C2.9 at 06:45, C4.1 at 07:22, C2.9 at 19:10, C3.5 at 19:35 and an M2.0 long duration event peaking at 22:51 UTC.
Region 10227 was quite dynamic during the day with spots coming and going. The centrally placed magnetic delta, which was
observed 24h ago, had disappeared by early morning, then redeveloped during early evening. Although this is a small region,
further minor M class flares could be possible. Flares: C2.1 at 04:25 and M1.3 at 23:36 UTC.
Region 10228 decayed early in the day and became spotless, then reemerged with a single spot after noon.
Region 10229 decayed in the leading spot section while the intermediate and trailing spots developed. Currently there
appears to be no polarity intermixing. An M class flare is possible. Flares: C2.3 at 01:45,
C4.8/1F at 09:29 UTC.
Comment added at 10:56 UTC on December 17: Changes noted today: The magnetic delta structure in a penumbra in the intermediate spot section of region 10226 has continued to strengthen while the delta previously noted near the leading penumbra has disappeared. Region 10227 has added several new spots and some penumbral area. A new region has emerged with several spots near the southeast limb. This is the same region as the one which had bright plage noted above under uncorrelated flares. This new region has 6 spots and is currently located near S09E70.
December 14-15: No obviously geoeffective CMEs noted.
December 16: A weak CME was associated with an M2.5 flare in region 10225. Most of the CME was visible off of the northeast limb and the north pole in LASCO C2 images, but there may have been some faint (and geoeffective) extensions as well. A larger CME was in progress off of the southwest limb most of the day (source: filament eruption).
Coronal hole history (starting late October 2002)
Compare today's report with the situation one solar rotation ago: 28
days ago
27 days ago 26 days ago
A trans equatorial, recurrent extension of the southern polar coronal hole was in a geoeffective position on December 15-16.
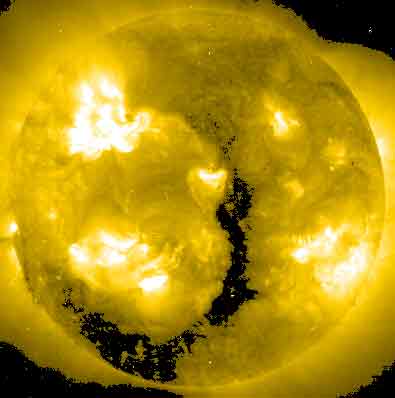
Processed SOHO EIT 284 image at 19:06 UTC on December 16. Any black areas on the solar disk are likely coronal holes.
The geomagnetic field is expected to be quiet to unsettled until sometime during the latter half of December 17 when a strong coronal stream is expected to arrive. Unsettled to major storm is possibly on Dec.17 after the arrival of this coronal stream and on December 18. Unsettled to active is likely on December 19-20. Long distance medium wave (AM) band propagation along east-west paths over high and upper middle latitudes is fair.
| Coronal holes (1) | Coronal mass ejections (2) | M and X class flares (3) |
 |
 |
|
1) Effects from a coronal hole could reach Earth within the
next 5 days.
2) Material from a CME is likely to impact Earth within 96 hours.
3) There is a possibility of either M or X class flares within the next 48
hours.
Green: 0-20% probability, Yellow: 20-60% probability, Red: 60-100% probability.

Composite image based on a SOHO/MDI continuum image and overlaid by a coronal hole image. Region numbering has been included. Compare to the previous day image.
Data for all numbered solar regions according to the Solar Region Summary provided by SEC/NOAA. Comments are my own, as is the STAR spot count (spots observed at or inside a few hours before midnight) and data for regions not numbered by SEC or where SEC has observed no spots.
| Solar region | Date numbered | SEC spot count |
STAR spot count |
Location at midnight | Area | Classification | Comment |
|---|---|---|---|---|---|---|---|
| 10215 | 2002.12.05 | S18W74 | plage | ||||
| 10217 | 2002.12.08 | N13W48 | plage | ||||
| 10218 | 2002.12.08 | 1 | 2 | S17W39 | 0020 | HSX | |
| 10220 | 2002.12.09 | 1 | 1 | S12W50 | 0040 | HSX | |
| 10221 | 2002.12.09 | N20W27 | plage | ||||
| 10222 | 2002.12.11 | S06W68 |
plage see comment below on region S54 |
||||
| 10223 | 2002.12.12 | 8 | 8 | N24E21 | 0110 | DSO | |
| 10224 | 2002.12.12 | 13 | 21 | S15E22 | 0120 | EAO | beta-gamma |
| 10225 | 2002.12.13 | 15 | 14 | N17E23 | 0100 | DAI | beta-gamma-delta |
| 10226 | 2002.12.13 | 28 | 27 | S28E12 | 0320 | EKI |
beta-gamma-delta area approximately 0600 at midnight |
| 10227 | 2002.12.13 | 9 | 14 | N07W07 | 0070 | DRI |
beta-gamma-delta classification was DSI at midnight |
| 10228 | 2002.12.14 | 1 | 1 | S17E37 | 0010 | AXX | |
| 10229 | 2002.12.14 | 28 | 33 | N18E37 | 0410 | EHI | |
| S49 | emerged on 2002.12.09 |
S22W61 | plage | ||||
| S54 | emerged on 2002.12.12 |
S13W66 |
plage SEC has this region as region 10222 |
||||
| S57 | emerged on 2002.12.14 |
S21W41 | plage | ||||
| Total spot count: | 104 | 121 | |||||
| SSN: | 194 | 211 | |||||
| Month | Average solar flux at Earth |
International sunspot number | Smoothed sunspot number |
|---|---|---|---|
| 2000.04 | 184.2 | 125.5 | 120.8 cycle 23 sunspot max. |
| 2000.07 | 202.3 | 170.1 | 119.8 |
| 2001.11 | 210.6 | 106.5 | 115.5 (+1.5) |
| 2001.12 | 235.1 | 132.2 | 114.6 (-0.9) |
| 2002.01 | 226.6 | 114.1 | 113.5 (-1.1) |
| 2002.02 | 205.0 | 107.4 | 114.7 (+1.2) |
| 2002.03 | 179.5 | 98.4 | 113.4 (-1.3) |
| 2002.04 | 189.8 | 120.7 | 110.5 (-2.9) |
| 2002.05 | 178.4 | 120.8 | 108.8 (-1.7) |
| 2002.06 | 148.7 | 88.3 | (106.4 predicted, -2.4) |
| 2002.07 | 173.5 | 99.9 | (102.8 predicted, -3.6) |
| 2002.08 | 183.6 | 116.4 | (99.6 predicted, -3.2) |
| 2002.09 | 175.8 | 109.3 | (96.6 predicted, -3.0) |
| 2002.10 | 167.0 | 97.5 | (93.1 predicted, -3.5) |
| 2002.11 | 168.7 | 95.0 | (87.8 predicted, -5.3) |
| 2002.12 | 160.9 (1) | 80.1 (2) | (83.5 predicted, -4.3) |
1) Running average based on the daily 20:00 UT observed solar flux value at 2800
MHz.
2) Unofficial, accumulated value based on the Boulder (SEC/NOAA) sunspot number. The official
international sunspot number is typically 25-45% less.
This report has been prepared by Jan Alvestad. It is based partly on my own observations and interpretations, and partly on data from sources noted in solar links. Comments and suggestions are always welcome.
| [DX-Listeners' Club] [DX News] |