
Last major update issued on July 13, 2005 at 05:45 UTC.
[Solar and
geomagnetic data - last month (updated daily)]
[Solar wind and
electron fluence charts (updated daily)]
[Solar cycles 21-23
(last update July 2, 2005)]
[Solar cycles 1-20]
[Graphical comparison
of cycles 21, 22 and 23 (last update July 2, 2005)]
[Graphical
comparison of cycles 2, 10, 13, 17, 20 and 23 (last update July 2, 2005)]
[Historical solar and
geomagnetic data charts 1954-2004 (last update February 1, 2005)]
[Archived reports
(last update July 2, 2005)]
The geomagnetic field was quiet to major storm on July 12. Solar wind speed ranged between 380 and 642 (all day average 494) km/sec. While no obvious solar wind shock was observed both SOHO and ACE data indicates that the CME observed on July 9 reached Earth during the first half of July 12, more specifically near 09h UTC. This CME had caught up with the tail end of the previous CME, merged with that one, and lost the most obvious characteristics associated with a CME shock.
Solar flux measured at 20h UTC on 2.8 GHz was 95.3. The planetary
A
index was 48 (STAR Ap - based on the mean of three hour interval ap
indices: 48.1).
Three hour interval K indices: 56566532 (planetary), 35555432 (Boulder).
The background x-ray flux is at the class C2 level.
At midnight there were 5 spotted regions on the visible solar disk. The solar flare activity level was moderate. A total of 11 C and 3 M class events was recorded during the day.
Region 10786 developed quickly as a huge asymmetric penumbra formed on a nearly north south axis. This penumbra is very
complex with moderate to strong magnetic delta structures in the north and south. Further M class flares are very likely, and a
major proton flare is a possibility. Flares: C4.2 at 02:10, C2.4 at 05:25, C1.5 at 06:31, C3.0
at 07:00, C8.3 at 08:03, C2.3 at 10:03, C3.1 at 11:27, C1.5 at 12:13, M1.0 at 13:06, C2.3 at 15:37, long duration M1.5 (with an
associated moderate type IV radio sweep) peaking at 16:24, C4.2 at 21:40, M1.3 at 22:52 and C4.0 at 23:38 UTC.
Region 10788 was quiet and stable.
Region 10789 decayed slowly and quietly.
Spotted regions not numbered by NOAA/SEC:
[S568] This region emerged in the southwest quadrant on July 12. There is some minor polarity intermixing. Location at
midnight: S11W21.
[S569] A new region emerged in the northeast quadrant on July 12. Location at midnight: N06E55
July 10-11: No obvious fully or partly Earth directed CMEs were observed during the day..
July 12: The M1 long duration event in region 10786 during the afternoon was associated with a faint full halo CME. While
parts of this CME were visible over the northwest limb at 17:42 UTC, it wasn't until 3 hours later that this developed into a full
halo CME when much fainter extensions became visible over the east limb in LASCO C3 images.
Coronal hole
history (since late October 2002)
Compare today's report with the situation one solar rotation ago: 28
days ago 27 days ago 26
days ago
There may be a small coronal hole in the northern hemisphere near the equator rotating into an Earth facing position on July 13.
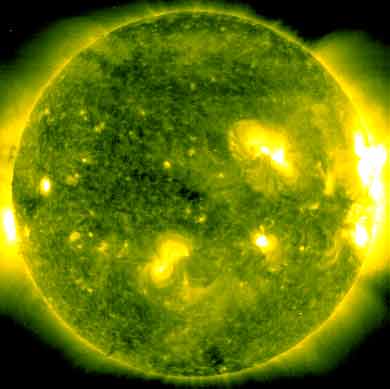
Processed SOHO/EIT 284 image at 01:06 UTC on July 13. The darkest areas on the solar disk are likely coronal holes.
The geomagnetic field is expected to be quiet to active on July 13 due to CME effects. Quiet to unsettled is likely on July 14 and the first half of July 15. A CME could reach Earth during the latter half of July 15 and cause unsettled to minor storm conditions.
| Coronal holes (1) | Coronal mass ejections (2) | M and X class flares (3) |
1) Effects from a coronal hole could reach Earth
within the next 5 days. When the high speed stream has arrived
the color changes to green.
2) Material from a CME is likely to impact Earth within 96 hours.
3) There is a possibility of either M or X class flares within the next
48 hours.
Green: 0-20% probability, Yellow: 20-60% probability, Red: 60-100% probability.
Long distance low and medium frequency (below 2 MHz) propagation along east-west paths over high and upper middle latitudes is unusable. Propagation along long distance north-south paths is poor during nighttime and fair to good during the hour after local sunrise. Trans Atlantic propagation conditions are normally monitored every night on 1470 kHz. Dominant stations tonight: Radio Cristal del Uruguay. Lots of stations from Argentina, Uruguay and Brazil were audible 15-70 minutes after local sunrise. In particular the Buenos Aires stations on 710, 790, 870, 950 and 1070 kHz had good signals.
Compare to the previous day's image.
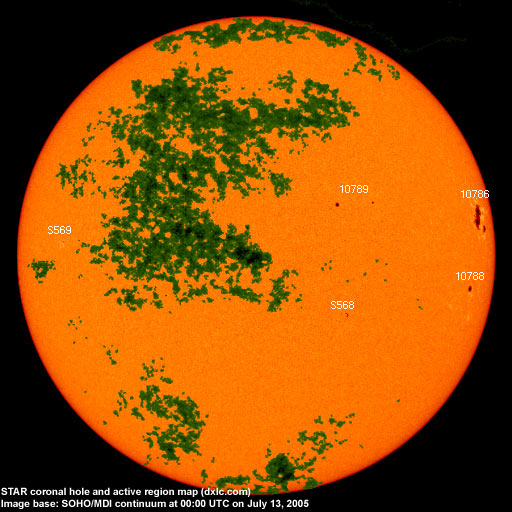
Data for all numbered solar regions according to the Solar Region Summary provided by NOAA/SEC. Comments are my own, as is the STAR spot count (spots observed at or inside a few hours before midnight) and data for regions not numbered by SEC or where SEC has observed no spots. SEC active region numbers in the table below and in the active region map above are the historic SEC/USAF numbers.
| Active region | Date numbered | SEC spot count |
STAR spot count |
Location at midnight | Area | Classification | Comment |
|---|---|---|---|---|---|---|---|
| 10786 | 2005.07.01 | 15 | 26 | N11W70 | 0270 | DAC |
beta-gamma-delta classification was DKC at midnight, area 0550 |
| 10788 | 2005.07.02 | 1 | 1 | S04W64 | 0070 | HAX | classification was HSX at midnight, location S06W63 |
| 10789 | 2005.07.03 | 6 | 3 | N17W23 | 0070 | EAO | classification was DSO at midnight |
| S567 | 2005.07.03 | S07W54 | plage | ||||
| S568 | 2005.07.12 | 7 | S11W21 | 0020 | BXI | ||
| S569 | 2005.07.12 | 2 | N06E55 | 0010 | AXX | ||
| Total spot count: | 22 | 39 | |||||
| SSN: | 52 | 89 | |||||
| Month | Average solar flux at Earth |
International sunspot number | Smoothed sunspot number |
|---|---|---|---|
| 2000.04 | 184.2 | 125.5 | 120.8 cycle 23 sunspot max. |
| 2000.07 | 202.3 | 170.1 | 119.8 |
| 2001.12 | 235.1 | 132.2 | 114.6 (-0.9) |
| 2004.05 | 99.8 | 41.5 | 43.8 (-1.7) |
| 2004.06 | 97.4 | 43.2 | 41.6 (-2.2) |
| 2004.07 | 119.1 | 51.1 | 40.2 (-1.4) |
| 2004.08 | 109.6 | 40.9 | 39.2 (-1.0) |
| 2004.09 | 103.1 | 27.7 | 37.5 (-1.7) |
| 2004.10 | 105.9 | 48.0 | 35.9 (-1.6) |
| 2004.11 | 113.2 | 43.5 | 35.3 (-0.6) |
| 2004.12 | 94.5 | 17.9 | 35.2 (-0.1) |
| 2005.01 | 102.2 | 31.3 | (34.6 predicted, -0.6) |
| 2005.02 | 97.2 | 29.1 | (33.3 predicted, -1.3) |
| 2005.03 | 89.9 | 24.8 | (31.6 predicted, -1.7) |
| 2005.04 | 86.0 | 24.4 | (29.7 predicted, -1.9) |
| 2005.05 | 99.3 | 42.6 | (27.2 predicted, -2.5) |
| 2005.06 | 93.7 | 39.3 | (25.7 predicted, -1.5) |
| 2005.07 | 114.4 (1) | 50.6 (2) | (24.7 predicted, -1.0) |
1) Running average based on the daily 20:00 UTC observed solar flux
value at 2800 MHz.
2) Unofficial, accumulated value based on the Boulder (NOAA/SEC)
sunspot number. The official international sunspot number is typically
30-50% lower.
This report has been prepared by Jan Alvestad. It is based partly on my own observations and analysis, and partly on data from some of these solar data sources. All time references are to the UTC day. Comments and suggestions are always welcome.
| [DX-Listeners' Club] |